Interested in this project?
I'm happy to discuss the blockchain analytics architecture, Solana/Xandeum integration, or data visualization approach.
Get In TouchLoading
XpanSieve Solutions is a digital agency and product studio focused on building practical software systems, web applications, and technical solutions.

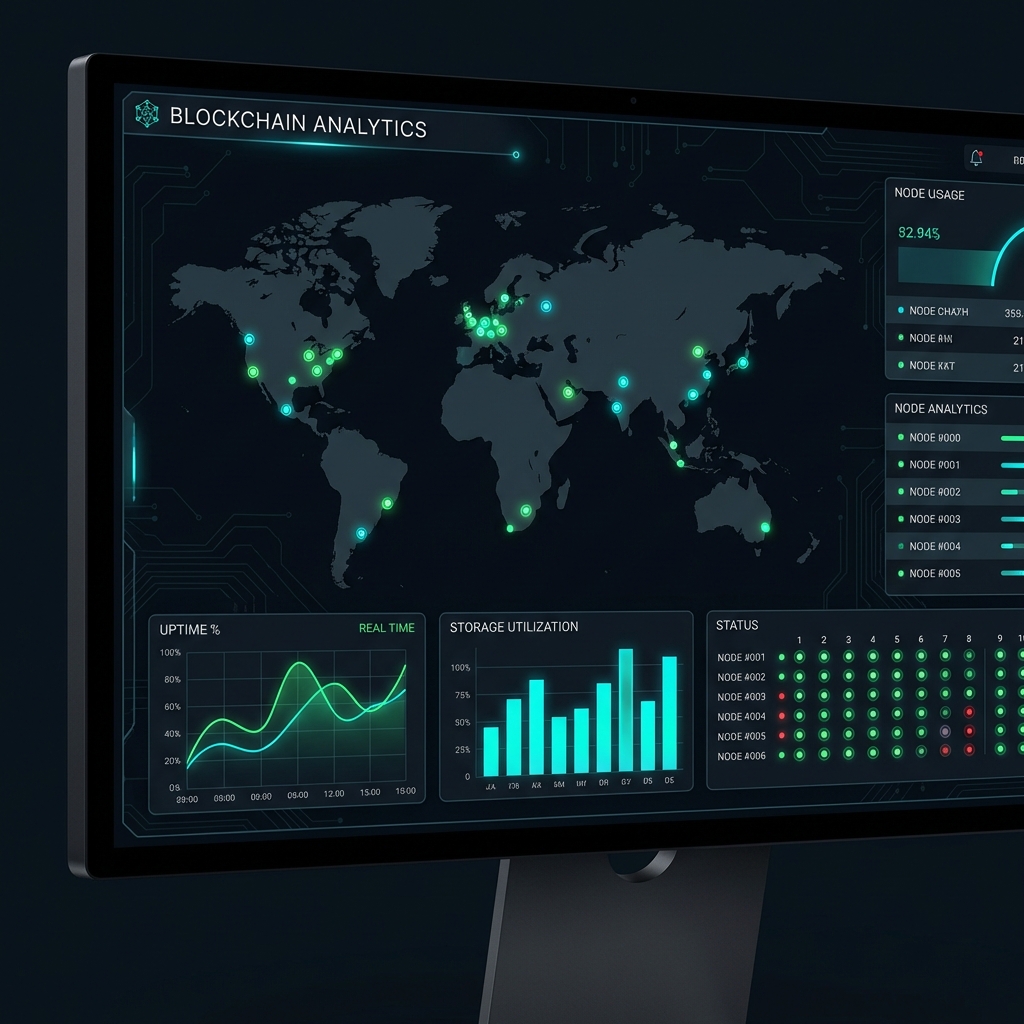
A real-time analytics dashboard built to monitor the health and performance of Xandeum's Provider Node (pNode) network. Xandeum is a scalable, decentralized storage layer built natively for the Solana blockchain — essentially adding a "hard drive" to Solana's "world computer." This dashboard was designed to fill a critical visibility gap in that ecosystem.
This project was developed as a response to a bounty program. While the bounty was not won, the project represents significant technical work in blockchain analytics, real-time data visualization, and Web3 infrastructure monitoring.
Xandeum extends Solana's capabilities by adding a decentralized storage layer. While Solana excels at fast transaction processing, it wasn't designed to store massive amounts of data. Xandeum bridges this gap by offloading heavy data to a network of Provider Nodes (pNodes) while maintaining native integration with Solana's smart contract programming model.
Unlike external storage solutions (Arweave, IPFS), Xandeum is integrated directly into Solana's programming model — smart contracts can read/write data to pNodes almost as easily as accessing their own state. This is the "Storage Trilemma" solution: scalability (exabytes), smart contract integration (native to Solana), and random access (quick retrieval of specific data).
At the time of development, the Xandeum pNode network had no public-facing monitoring dashboard. Stakeholders faced critical blind spots:
The dashboard was designed to act as the "Solscan" or "Etherscan" specifically for the Xandeum storage layer, providing transparency that didn't exist.
Real-time monitoring: The dashboard polls the
get-pods-with-stats RPC method to fetch live pNode status, providing instant
Up/Down indicators for every node in the network.
Historical analysis: Performance data is tracked and visualized across 24-hour, 7-day, and 30-day windows, allowing operators to identify trends, degradation patterns, and uptime reliability.
Geographic visualization: Using Leaflet.js, nodes are plotted on an interactive world map, giving stakeholders a visual understanding of the network's geographic decentralization — critical for assessing resilience.
Automated alerts: The system was designed to trigger notifications for uptime issues, storage utilization spikes, and performance anomalies — moving from reactive to proactive monitoring.
The frontend is built with React and Chart.js for data visualization, with Leaflet handling the geographic map component. The backend aggregates data from Xandeum's RPC endpoints, processes it into time-series metrics, and serves it through a REST API. Historical data is stored in PostgreSQL for trend analysis.
The bounty was not won, but the project was a valuable exercise in building analytics infrastructure for a real blockchain ecosystem. It required understanding Solana's architecture, Xandeum's pNode protocol, real-time data pipelines, and effective data visualization — all areas that have direct transferability to other monitoring and analytics projects.
This is an experimental build — it was developed for a specific bounty context and represents exploration into the Web3 analytics space.